Resource Center
Grow your healthcare career with tips, trends and other insights.
Featured
Keep up on the latest industry trends and best practices for healthcare professionals.
-

25 Items for Nurses: Essentials Nurses Can’t Work Without
Working as a nurse is no small feat. Long hours, unpredictable shifts, and the constant call for multitasking…
-

CE Myths You Might Believe
As a licensed professional, you know the drill. Every two (or one, or three years, depending on your…


Nursing
Find information to help you advance your nursing career and gain new skills.
-

Yes, You DO Need Sunscreen Indoors
The importance of sunscreen When I was a teen, it was considered an outrage to have pale skin…
-

Missed Red Flags: Critical Postpartum Conditions Nurses Need to Know
For many new mothers, the weeks following birth are a blur of sleepless nights, diaper changes, and learning…
-

A Nurse’s Guide to Natural Psychedelics
As nurses, we are often the first to field questions from patients about emerging health trends. You’ve likely…
-

When the Cure Hurts: Alternative Therapies for Chemo Adverse Events
Working in oncology nursing means standing on the front lines of patient care, witnessing both the triumphs of…


Physicians
Find information to help you advance your physician career and gain new skills.
-

The Fungus Among Us: Treating Fungal Skin Diseases
Fungal skin diseases are a growing challenge for physicians worldwide. From everyday cases of athlete’s foot to the…
-

Weight-Loss Diets: A Provider’s Perspective
Approximately 74% of U.S. adults are overweight, and nearly 42% meet the criteria for obesity. As a practicing…
-

3 Great Reasons Not to Put Off That Colonoscopy
As a physician, you know the drill. You reach the point in a patient’s annual physical where you…
-

What Providers Need to Know About Foodborne Diseases
Food safety is a significant public health concern that affects millions of Americans every year. According to the…


Physical Therapy
Find information to help you advance your physical therapy career and gain new skills.
-

Billing Basics: What PTs Need to Know
Navigating the world of physical therapy billing can often feel like learning a completely different language. You went…
-

Power Mobility Assessment for PTs
For many patients, mobility is the key to independence. But when a manual wheelchair isn’t enough, and a…
-

Mental Health Self-Care Checklist for PT Professionals
Physical therapists spend their careers helping others recover, rebuild, and regain their quality of life. But who’s looking…
-

Anger Management: PT Interventions to Help Parents Cope
At some point, it happens to every physical therapist. A session is going smoothly, and then suddenly, the…


Massage Therapy
Find information to help you advance your massage therapy career and gain new skills.
-

The Financial Side of Massage Therapy
You spent countless hours learning anatomy, perfecting your techniques, and earning your license. You know exactly how to…
-

Understanding Trauma Physiology
Your client walks in tense, guarded, and exhausted. They’ve tried everything—chiropractic care, physical therapy, pain medication—and nothing has…
-

Building Your Massage Therapy Practice
Many talented bodyworkers leave massage school with excellent hands-on skills but feel lost when it comes to the…
-

4 Rewarding Career Paths in Massage Therapy
You’ve put in the hours, studied the anatomy, and passed your exams. Now you hold that license in…


Cosmetology
Find information to help you advance your cosmetology career and gain new skills.
-

Gender Inclusivity in the Salon
The beauty industry constantly evolves to reflect the latest styles, movements, and societal shifts. Just as the 1970s…
-

How Do I Become a Licensed Esthetician?
A career in esthetics offers the perfect blend of creativity, personal connection, and real earning potential. If you…
-

The Business of Beauty: Maximizing Your Salon’s Potential
Are you ready to start building the salon business of your dreams? Whether you’re a seasoned salon owner…
-

Increase Your Income with These Salon Specialty Services
Are you looking for new ways to grow your client base and increase your income? Diversifying your service…


Dental
Find information to help you advance your dental career and gain new skills.
-
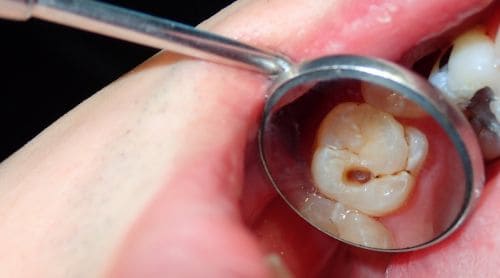
Treating Caries-Prone Patients
Maybe you’ve seen it before. A patient does their best to take care of their teeth, and yet,…
-

Caring for Pediatric Dental Patients with Complex Needs
More pediatric patients with complex medical conditions are walking through dental office doors than ever before. Advances in…
-

How Do I Become a Dental Hygienist?
If you’ve ever sat in a dentist’s chair, you’ve likely met a dental hygienist. They’re the friendly experts…
-
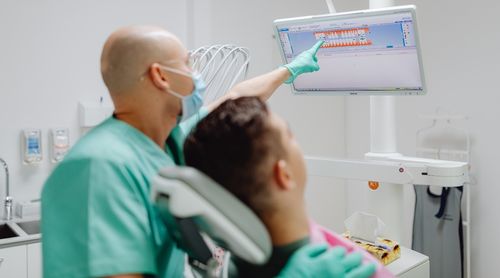
Navigating Dental Ethics in the Digital Age: A Guide for Modern Practice
The practice of dentistry has evolved significantly over the last few decades. While the core goal of improving…


Occupational Therapy
Find information to help you advance your occupational therapy career and gain new skills.
-

Understanding Alzheimer’s Disease: A Guide for Occupational Therapists
Few conditions are as complex and pervasive in the geriatric population as Alzheimer’s disease. With the population of…
-

Supporting Young Adults with Autism Spectrum Disorder: An OT Guide
The transition from adolescence to adulthood marks a pivotal time in anyone’s life. For young adults with autism…
-
What is Upper Limb Ataxia?
Upper limb ataxia can turn simple daily tasks like buttoning a shirt or pouring coffee into frustrating challenges.…
-

Breaking the Cycle: OT Strategies for Managing Pain Without Opioids
Chronic pain affects roughly one in five people globally. It’s a complex, multifaceted condition that touches every part…


Social Work
Find information to help you advance your social work career and gain new skills.
-

Celebrating Social Work Month: Honoring the Professionals Who Uplift Communities
Every March, we take time to recognize the incredible contributions of social workers across the country. Social Work…
-

Chronic Pain: The Brain-Body Connection
Pain is universal, subjective, and one of the leading causes of disability. Culture, temperament, mental state, memory, cognitive…
-

Human Trafficking: A Global Crime With Local Consequences
Healthcare professionals are often uniquely positioned to spot the signs of human trafficking. In crisis situations, they can…
-

Technology and Healthcare: The Rise of Digital Twins
Technology and healthcare have a long, shared history, from ancient Egypt and the first prostheses to modern imaging…


Psychology
Find information to help you advance your psychology career and gain new skills.
-

When Life Hurts: Non-Suicidal Self-Injury
Self-injury, also known as self-harm or non-suicidal self-injury (NSSI), is the act of deliberately inflicting harm on one’s…
-

Nursing Interventions for Body Dysmorphic Disorder
Body Dysmorphic Disorder (BDD) is an under-diagnosed and often misdiagnosed mental health condition due to the similarity of…
-

Diabulimia: What It Is and How to Approach It
“Diabulimia,” the pediatric endocrinologist told me. “She is missing her doses on purpose.” “Diabulimia?” I asked. I had never heard of…
-

‘First, Do No Harm’: Patient Safety for Healthcare Professionals
It’s a fact of life: Mistakes happen. When those mistakes involve medical errors, however, the costs can be…


Veterinarian
Find information to help you advance your veterinarian career and gain new skills.
-

An Update on Zoonotic Diseases
Keeping our animal patients healthy often means keeping their human companions safe, too. As a veterinary professional, you…
-

Veterinary Ethics in Florida Practice
Practicing veterinary medicine in Florida means more than caring for animals. It means operating within a well-defined legal…
-

A Stable Future: Expanding Into Equine Veterinary Care
Adding large animal services to your existing veterinary practice can feel like a giant leap. You might wonder…
-

What to Do When Veterinary Burnout Hits
Working in veterinary medicine requires immense compassion, skill, and resilience. But even the most dedicated professionals can find…


Funeral
Find information to help you advance your funeral career and gain new skills.
-

Marketing Your Funeral Services (Without Being Insensitive)
Marketing your funeral business often feels like walking a tightrope. You need to reach new families and grow…
-

The Survivor’s Guide to Social Security Benefits
When a family loses a loved one, grief takes center stage. But in the background, there are practical…
-

Supporting Survivors After Suicide: A Guide for Funeral Professionals
Walking a family through the arrangements after a natural death is challenging enough. But when a death is…
-

Beyond the Service: The Essential Guide to Aftercare for Funeral Professionals
The guests have left, the flowers are fading, and the silence of an empty house begins to settle…


Printables
-

West Virginia Nursing CE Checklist
West Virginia RNs and LPNs now operate on a two-year licensing cycle, requiring 12 contact hours of continuing…
-

Pennsylvania Nursing CE Checklist
If you’re looking to renew your Pennsylvania nursing license, here’s a quick summary of what you need. Click…
-

Florida Nursing CE Checklist
If you’re looking to renew your Florida nursing license, here’s a quick summary of what you need. Click below…
-

Spooky Coloring Pages for Nurses
Nursing is a demanding profession. The long hours, high stakes, and emotional toll can lead to stress and…

